5 Smart Tools to Predict Climate
2. Your Warming World: The web-portal gives the temperature variation in the city of your choice. A graph is also drawn beside to help you understand how the average temperature is raising in your locality. It sports an easy to use interface that allows you to select any city in the world and see the change from 1894 to 2013. The time frame is split into slots of 20 years each. The map includes yellow, orange and red heat points to show how much an area has warmed over time.
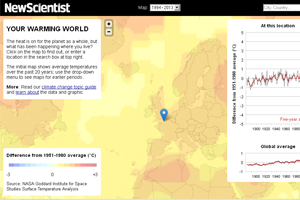 Your Warming World was developed by New Scientist using the data from NASA’s Goddard Institute for Space Studies. Surface temperature is considered for displaying the heat attribute in maps.
3. Derived Downscaled Climate Projection Portal: The United States Geological Survey is helping people view climate forecasts of their locale with its Climate Projection portal. Developed and maintained by the government of the U.S., the portal’s predictions are based on a model that is statistically scaled down. It was developed based on ‘International Panel on Climate Change Special Report on Emissions Scenarios’.
You can control what is shown on the map using the toolbar on the left. The pictorial representation of the climate with the help of easy to understand maps give the user information about climate parameters like temperature and precipitation.
Read More:
Sweet! Bio-Batteries That Run On Sugar to Power Smartphones for 10 Days