
6 Marvelous Sites For One-Stop Data Visualization
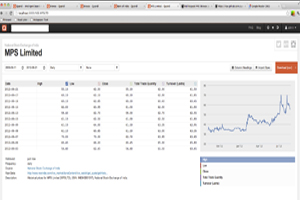 Quandl:
This website mainly aims to “make all the numerical data on the Internet easy to find and easy to use." The website has more than 6 million information sets from 400+ sources, with topics such as economics, finance, health and education being the front runners.
One of the major advantages in using Quandl is that the website helps you to subset and layout the data as well as project appropriate data visualizations.
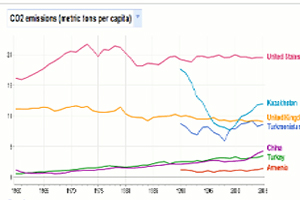 Google Public Data Explorer:
As we all know Google is also called ‘the search giant’, even in the Public Data Explorer, everything works with search and keywords. This site aims at making large datasets easy to find as well as analyze. Google also uses official and trusted data from sources such as ITU, Eurostat and the U.S. Bureau of Labor Statistics.
Google Public Data Explorer offer various ways for interaction as they supply tools to assist visualization data, such as use of bar charts, bubble charts and maps. Although visualizations can be embedded and shared, they cannot be downloaded.
Also Read: Meet Apple's 9 Eminent Security Rock Stars
Also Read: 10 Best Companies In Cloud Computing


